Description
VoltiBand Trend is designed for traders who want to exploit price overextensions without fighting the market. The strategy looks for moments when price pushes beyond typical boundaries, then reverts back toward equilibrium—while only participating when the broader trend structure supports the direction of the trade. This combination helps reduce “random” mean-reversion entries and instead focuses on reversals that occur within a controlled directional context.
Risk is managed dynamically using ATR-based stop-loss and take-profit targets, allowing the strategy to scale its trade management to the market’s current volatility. This is a key advantage versus fixed-distance exits, particularly on M5 where volatility can shift quickly session to session. VoltiBand Trend also includes an optional volatility regime filter so traders can restrict activity to high-volatility or low-volatility environments, depending on how they want the strategy to behave.
Overall, VoltiBand Trend is best suited for disciplined traders who prioritize repeatable logic, volatility-aware risk controls, and the ability to tune selectivity—rather than chasing high win rates or constant trade flow.
License & Delivery
Your purchase includes a 1-year license to use this algorithm on MetaTrader 5.
After checkout, the Uptiq team will prepare your personalized license and algorithm, which will be delivered via email within 24 hours.
Licenses are tied to the user’s trading environment and are intended for individual use only.
Backtest Performance Summary
Strategy: VoltiBand Trend
Asset Tested: EURUSD
Timeframe: M5 (5-Minute)
Date Range: January 1, 2025 – December 14, 2025
Initial Deposit: $10,000
Lot Size: 0.1
History Quality: 100%
Performance Metrics
Total Net Profit: $324.40
Gross Profit: $713.90
Gross Loss: -$389.50
Profit Factor: 1.83
Recovery Factor: 3.12
Expected Payoff per Trade: $4.92
Sharpe Ratio: 12.52
Z-Score (Trade Independence): 0.33 (25.86%)
LR Correlation: 0.84
LR Standard Error: 70.13
Drawdown & Risk
Balance Drawdown (Absolute): $6.30
Balance Drawdown (Max): $81.90 (0.79%)
Equity Drawdown (Absolute): $7.90
Equity Drawdown (Max): $104.00 (1.00%)
Equity Drawdown (Relative): 1.00% ($104.00)
Margin Level: 4381.07%
Trade Statistics
Total Trades: 66
Total Deals: 132
Short Trades Won: 34 (32.35%)
Long Trades Won: 32 (34.38%)
Profit Trades (% of Total): 22 (33.33%)
Loss Trades (% of Total): 44 (66.67%)
Average Profit Trade: $32.45
Average Loss Trade: -$8.85
Largest Profit Trade: $117.30
Largest Loss Trade: -$20.40
Max Consecutive Wins: 3 ($184.00)
Max Consecutive Losses: 6 (-$64.50)
Average Consecutive Wins: 1
Average Consecutive Losses: 3
What do these performance metrics mean?
Total Net Profit – The total dollar profit or loss generated during the backtest after all trades were closed. Positive values indicate profitability during the test period.
Gross Profit – The combined dollar amount of all winning trades. Useful for comparing against gross loss to understand efficiency.
Gross Loss – The combined dollar amount of all losing trades. Lower values indicate better downside control.
Profit Factor – The ratio of gross profit to gross loss. Values above 1.0 indicate profitability, while higher values suggest stronger historical edge.
Expected Payoff – The average profit or loss per trade. Positive values indicate positive expectancy over time.
Recovery Factor – Measures how efficiently a strategy recovers from drawdowns by comparing net profit to maximum drawdown.
Sharpe Ratio – A risk-adjusted return metric that measures consistency of returns. Higher values indicate smoother performance.
Z-Score (Trade Independence) – Indicates whether wins and losses occur randomly or in streaks. This does not measure profitability.
LR Correlation – Shows how closely the equity curve follows a linear growth path. Values closer to 1.0 indicate smoother growth.
LR Standard Error – Measures deviation from linear equity growth. Lower values suggest more stable performance.
Balance Drawdown – The largest decline in account balance during the test, shown in both dollar and percentage terms.
Equity Drawdown – The largest unrealized drawdown including open trades. Often a more realistic measure of risk.
Total Trades – The total number of completed trades in the backtest. Larger samples provide more statistical confidence.
Profit Trades (%) – The percentage of trades that were profitable. Higher is not always better.
Loss Trades (%) – The percentage of trades that resulted in a loss.
Average Profit Trade – The average dollar gain of winning trades.
Average Loss Trade – The average dollar loss of losing trades.
Largest Profit / Loss – The biggest single winning or losing trade during the test.
Consecutive Wins / Losses – The longest streaks of wins or losses, useful for setting expectations.
Margin Level – Indicates how much margin is being used. Higher values suggest more conservative leverage.
History Quality – Reflects the quality of historical data used in the backtest. Higher values indicate more reliable modeling.
Important: Backtests are historical simulations and do not guarantee future results. Metrics should be evaluated collectively, not in isolation.
Summary Insight
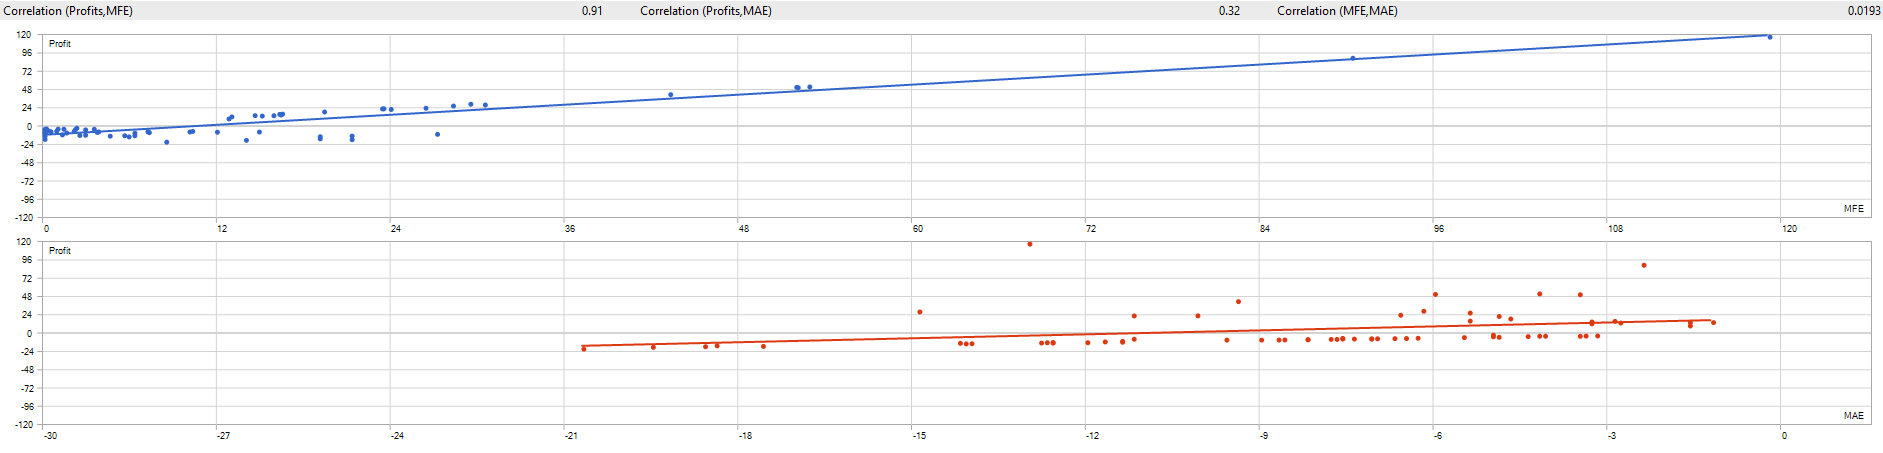
VoltiBand Trend delivered a controlled, low-drawdown profile in this test, keeping maximum equity drawdown near 1% while producing a positive net return across 66 trades. The win rate is intentionally lower, which is consistent with “selective mean-reversion within trend” systems—where profitability comes from maintaining a favorable reward-to-risk structure and disciplined exits, not from winning most trades.
This strategy’s design is particularly relevant for traders who want adaptive risk sizing (ATR-based) and the ability to filter out unfavorable market regimes. Users should validate results across additional symbols, timeframes, and volatility environments—especially with realistic spreads and execution assumptions—to confirm robustness.
Strategy Classification & Ideal Trader
Strategy Level: Intermediate
Ideal For
- Traders who want a structured pullback/overextension framework but still demand trend alignment
- Users comfortable with lower win rates in exchange for controlled risk and asymmetric payoffs
- Traders who prefer adaptive SL/TP sizing that responds to volatility (ATR-based)
- Users who want the option to restrict trading to specific volatility regimes
Not Ideal For
- Beginners who need frequent wins to stay disciplined
- Traders seeking high-frequency scalping systems
- Users who prefer fixed-price-pattern strategies without volatility adaptation
Click to preview trade report: VoltiBand Trade Report


Disclosure
This trading strategy is provided for educational and informational purposes only and is intended to be used solely as a trading tool. Past performance, including backtest results, is not indicative of future results. Trading involves substantial risk and may not be suitable for all investors. Backtested results are generated using historical data and idealized execution assumptions and do not account for slippage, commissions, liquidity constraints, variable spreads, or real-time market conditions. Users are strongly advised to test all settings in a demo environment and fully understand the risks before trading live. Uptiq and its affiliates assume no responsibility for financial losses resulting from the use or misuse of this strategy.
Volatility / Mean-Reversion Disclosure
VoltiBand incorporates mean-reversion logic and volatility-based sizing. In strong trending markets, “overextension” conditions may persist longer than expected, and volatility regime shifts can materially change strategy behavior. ATR-based exits expand and contract with volatility, which may alter trade duration and risk exposure. Users should validate performance under different volatility environments and consider conservative risk settings before live trading